Carbon Intensity
Carbon intensity measures the grams of CO₂ emitted per kWh of electricity consumed and provides real-time insight into the carbon impact of grid electricity. It enables organisations to align operational decisions with actual grid emissions performance by using live data, historical trends, generation mix information, and forward forecasts. This allows you to quantify emissions impact, compare regional performance, and schedule energy-intensive activities during lower-carbon periods. Our Make Custom App connects directly to the official carbon intensity data source, enabling automated data retrieval, emissions-based workflow triggers, and seamless integration of carbon metrics into dashboards, reports, and operational systems, giving you a structured and scalable way to embed carbon intelligence into your automation environment without added technical complexity.
Carbon Intensity Data
Carbon Intensity provides real-time carbon intensity data for any location in the world.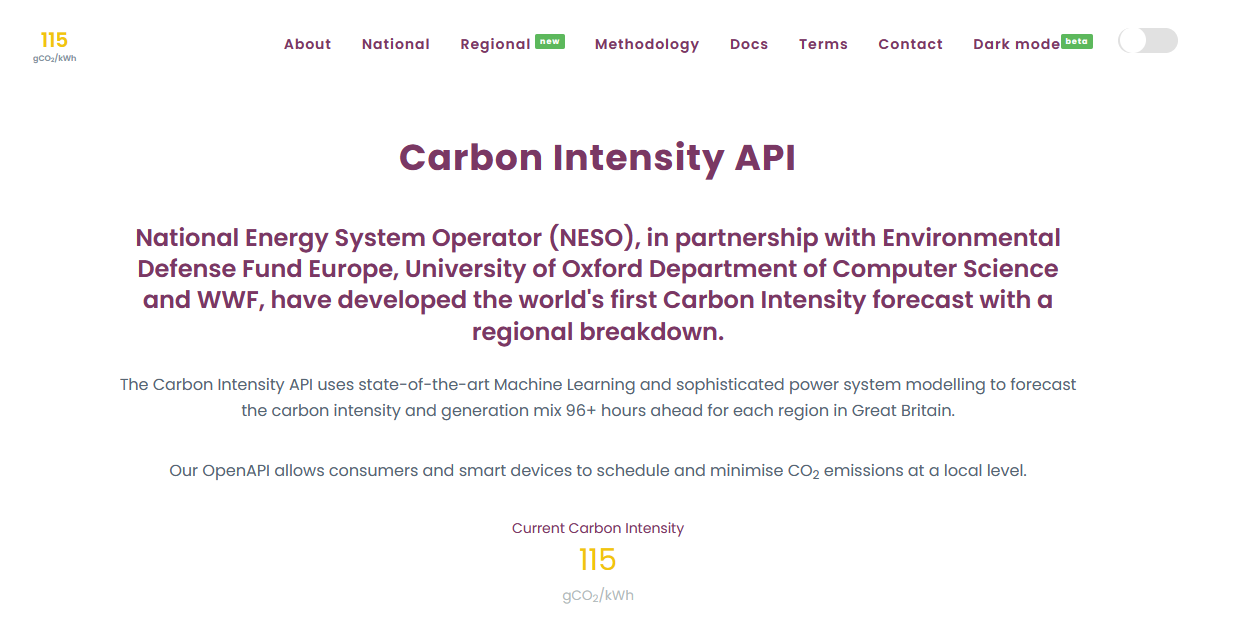
Energy Import Data
Carbon Intensity shows the currect energy imports to a given region.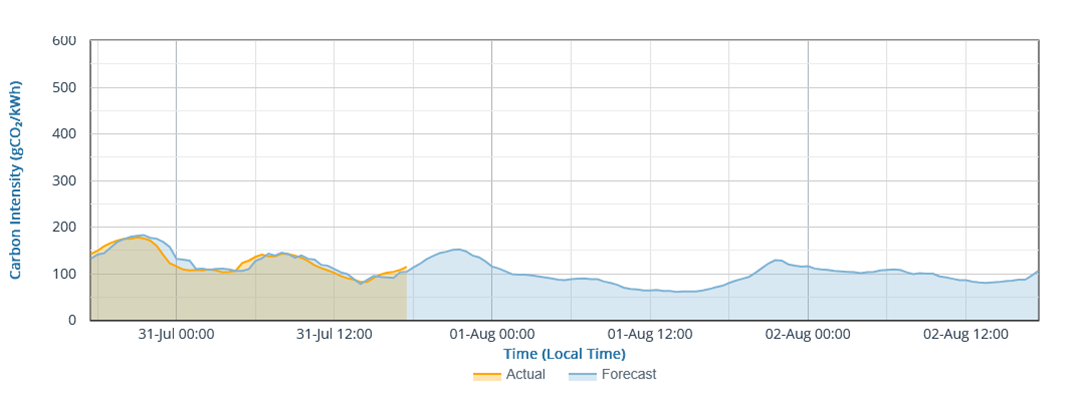
Live Carbon Intensity
Carbon Intensity provides real-time carbon intensity data for any location in the world.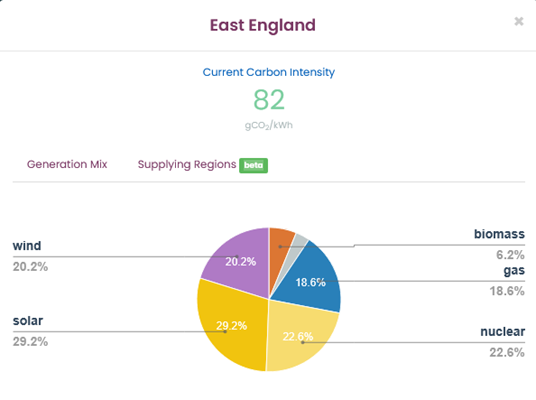
What's Included
- ☑️Get Live Carbon Intensity
Retrieve real-time carbon intensity (gCO₂eq/kWh) for any location using zone ID or geolocation.
- ☑️Get Recent Carbon Intensity
Retrieve carbon intensity data for the past 24 hours, with 60-minute resolution.
- ☑️Get Past Carbon Intensity History
Query historical carbon intensity data for a specific date or time.
- ☑️Get Past Carbon Intensity History Range
Retrieve carbon intensity over a date range (max 10 days) for a location.
- ☑️Get Forecasted Carbon Intensity
Access future carbon intensity forecasts based on grid modelling.
- ☑️Get Past Marginal Carbon Intensity History
Retrieve historical marginal carbon intensity with 1–2 month delay.
- ☑️Get Past Marginal Carbon Intensity History Range
Retrieve marginal carbon intensity over a range with temporal constraints.
- ☑️Get Live Power Breakdown
View the latest data on electricity production types and their contribution in a region.
- ☑️Get Recent Power Breakdown
Access the last 24 hours of generation mix and consumption statistics.
- ☑️Get Past Power Breakdown History
View historic energy source breakdowns for a given point in time.
- ☑️Get Past Power Breakdown History Range
Retrieve power source breakdown across a historical range (up to 10 days).
- ☑️Get Forecasted Power Breakdown
Retrieve near-future forecasts of power generation mix in a region.
- ☑️Make an API Call
Perform a custom authorized API call to any Electricity Maps endpoint for advanced use cases.