Electricity Maps
Electricity Maps provides live, historical, marginal, and forecast data on electricity carbon intensity and power generation across global grids, giving organisations clear visibility into how clean or carbon-intensive electricity is at any given time and location. Through our Make Custom App, this electricity data can be brought directly into automated workflows, enabling teams to act on real grid conditions for carbon-aware scheduling, emissions tracking, reporting, dashboards, and internal alerts. The integration simplifies access to Electricity Maps data, delivers structured and consistent outputs, and makes it straightforward to embed electricity intelligence into operational and sustainability processes.
Carbon Intensity
Electricity Maps provides real-time carbon intensity data for any location in the world.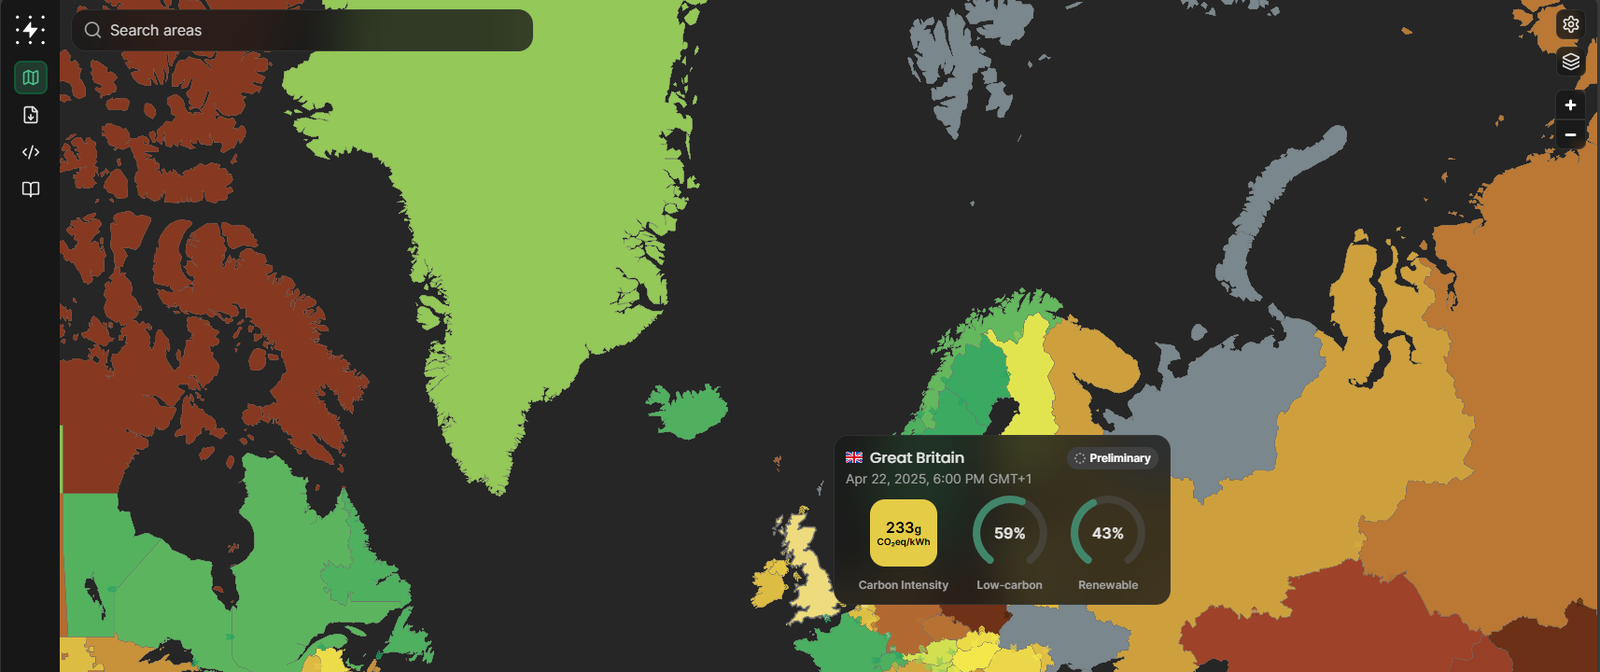
Energy Import Data
Electricity Maps shows the currect energy imports to a given region.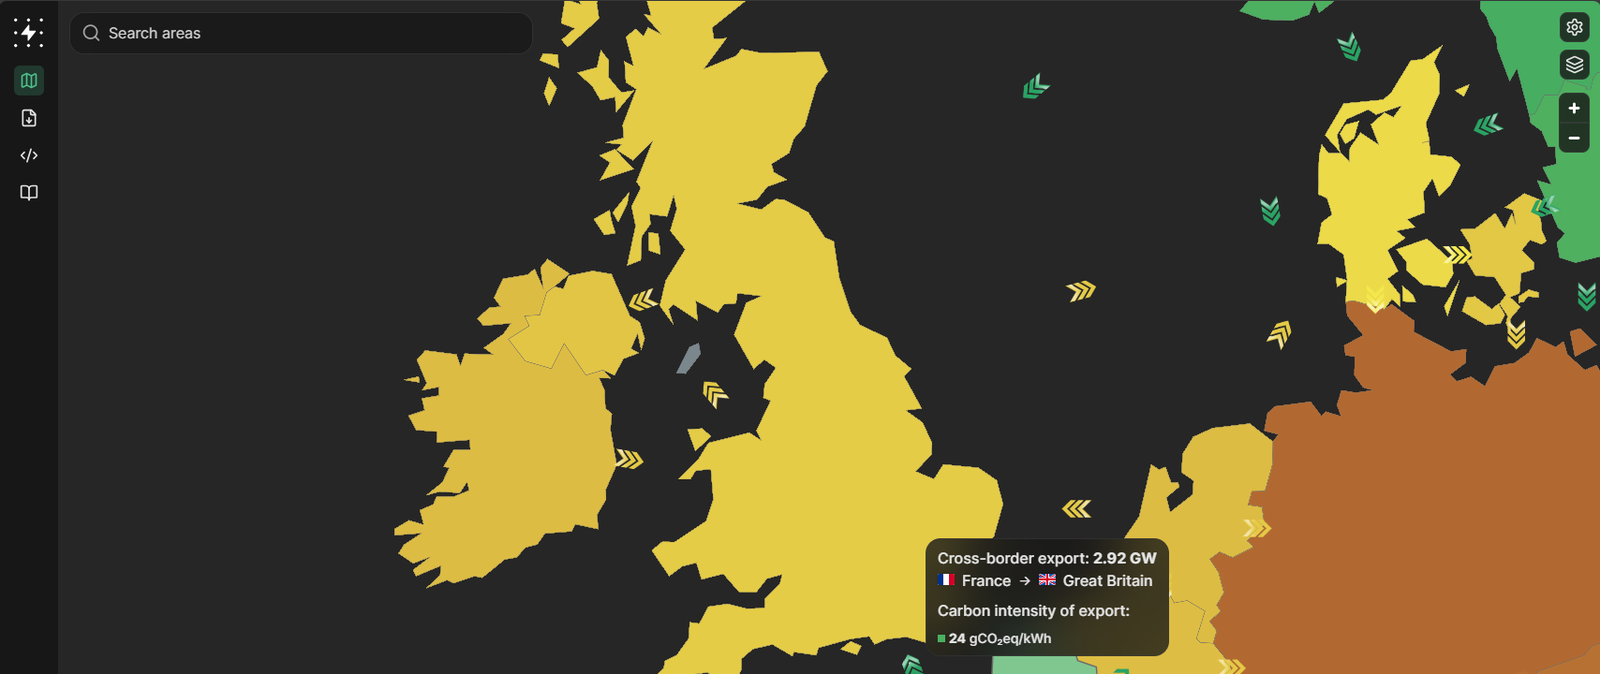
Live Carbon Intensity
Electricity Maps provides real-time carbon intensity data for any location in the world.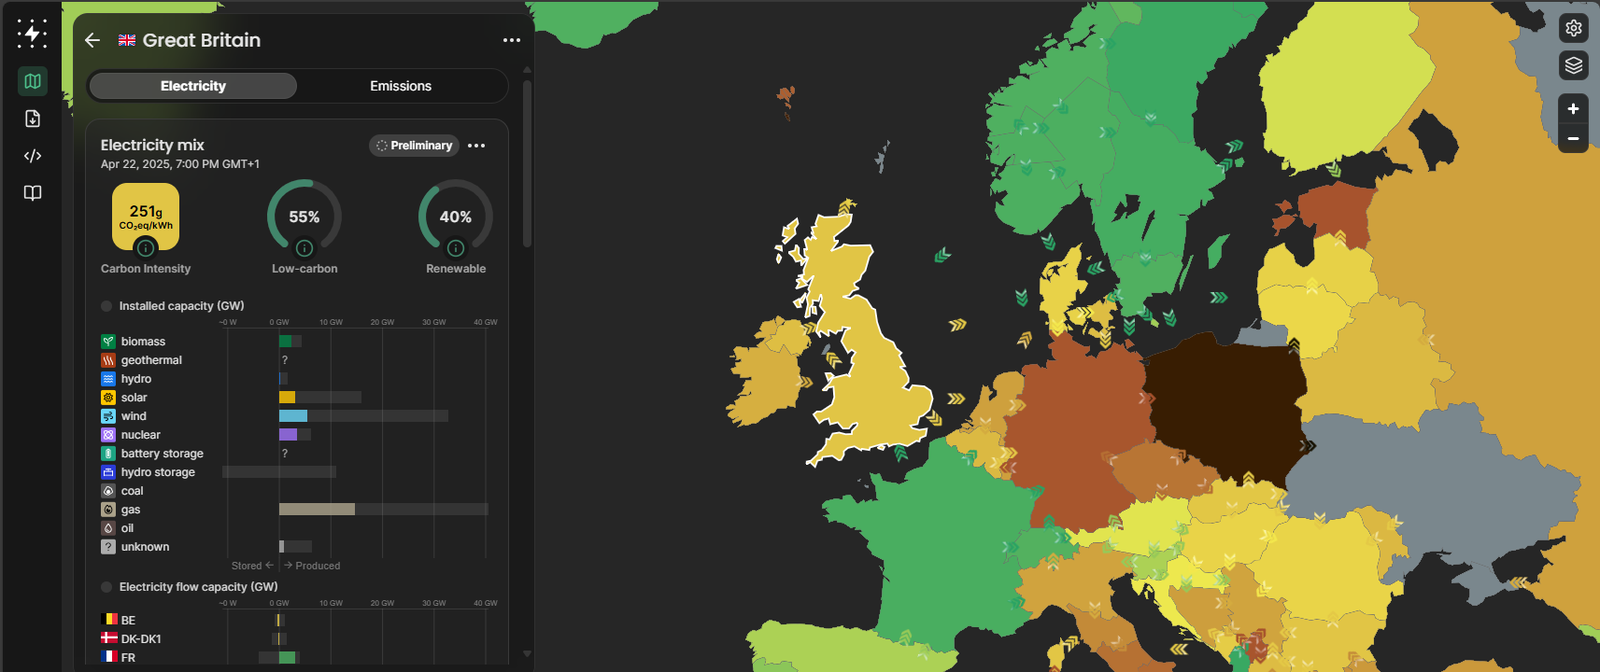
What's Included
- ☑️Get Live Carbon Intensity
Retrieve real-time carbon intensity (gCO₂eq/kWh) for any location using zone ID or geolocation.
- ☑️Get Recent Carbon Intensity
Retrieve carbon intensity data for the past 24 hours, with 60-minute resolution.
- ☑️Get Past Carbon Intensity History
Query historical carbon intensity data for a specific date or time.
- ☑️Get Past Carbon Intensity History Range
Retrieve carbon intensity over a date range (max 10 days) for a location.
- ☑️Get Forecasted Carbon Intensity
Access future carbon intensity forecasts based on grid modelling.
- ☑️Get Past Marginal Carbon Intensity History
Retrieve historical marginal carbon intensity with 1–2 month delay.
- ☑️Get Past Marginal Carbon Intensity History Range
Retrieve marginal carbon intensity over a range with temporal constraints.
- ☑️Get Live Power Breakdown
View the latest data on electricity production types and their contribution in a region.
- ☑️Get Recent Power Breakdown
Access the last 24 hours of generation mix and consumption statistics.
- ☑️Get Past Power Breakdown History
View historic energy source breakdowns for a given point in time.
- ☑️Get Past Power Breakdown History Range
Retrieve power source breakdown across a historical range (up to 10 days).
- ☑️Get Forecasted Power Breakdown
Retrieve near-future forecasts of power generation mix in a region.
- ☑️Make an API Call
Perform a custom authorized API call to any Electricity Maps endpoint for advanced use cases.